
What Is a Conversion Funnel and Why Does It Matter?
Think of your website like a physical, brick-and-mortar store. People walk by, some glance in the window, a few step inside to browse, and a smaller group still will actually buy something. The conversion funnel is just a way to visualize that exact customer journey online, showing how a large number of potential customers gets smaller and smaller at each step.
This is where conversion funnel analysis comes in. It’s the art of looking at this journey to figure out where people are dropping off and, more importantly, why. It’s less about the final sale and more about understanding the folks who left. By finding these “leaks,” you can fix the problems, smooth out the user experience, and guide more people all the way to a purchase.
The Core Stages of the Customer Journey
To really dig in, you have to understand the different phases a person goes through. While you can customize funnels for your specific business, they almost always follow a classic pattern of human decision-making. These stages aren’t just corporate-speak; they represent real shifts in a person’s mindset.
- Awareness: This is the very top of the funnel (often called ToFu). It’s the first “hello.” Someone might stumble upon your brand through a social media post, a blog article they found on Google, or an ad. At this point, they know they have a problem, but they’re just starting to look for answers.
- Consideration: Now that they know you exist, they’re sizing you up. In this middle stage, they’re actively comparing your products or services to your competitors. They’re digging deeper by reading reviews, watching your webinars, or comparing feature lists. Their goal is to find the best possible solution for their needs.
- Conversion: This is the moment of truth, the bottom of the funnel. The user has done their homework and is ready to make a move. For an ecommerce store, this is hitting “Add to Cart” and finishing the checkout. For a software company, it might be signing up for a free trial or booking a demo call.
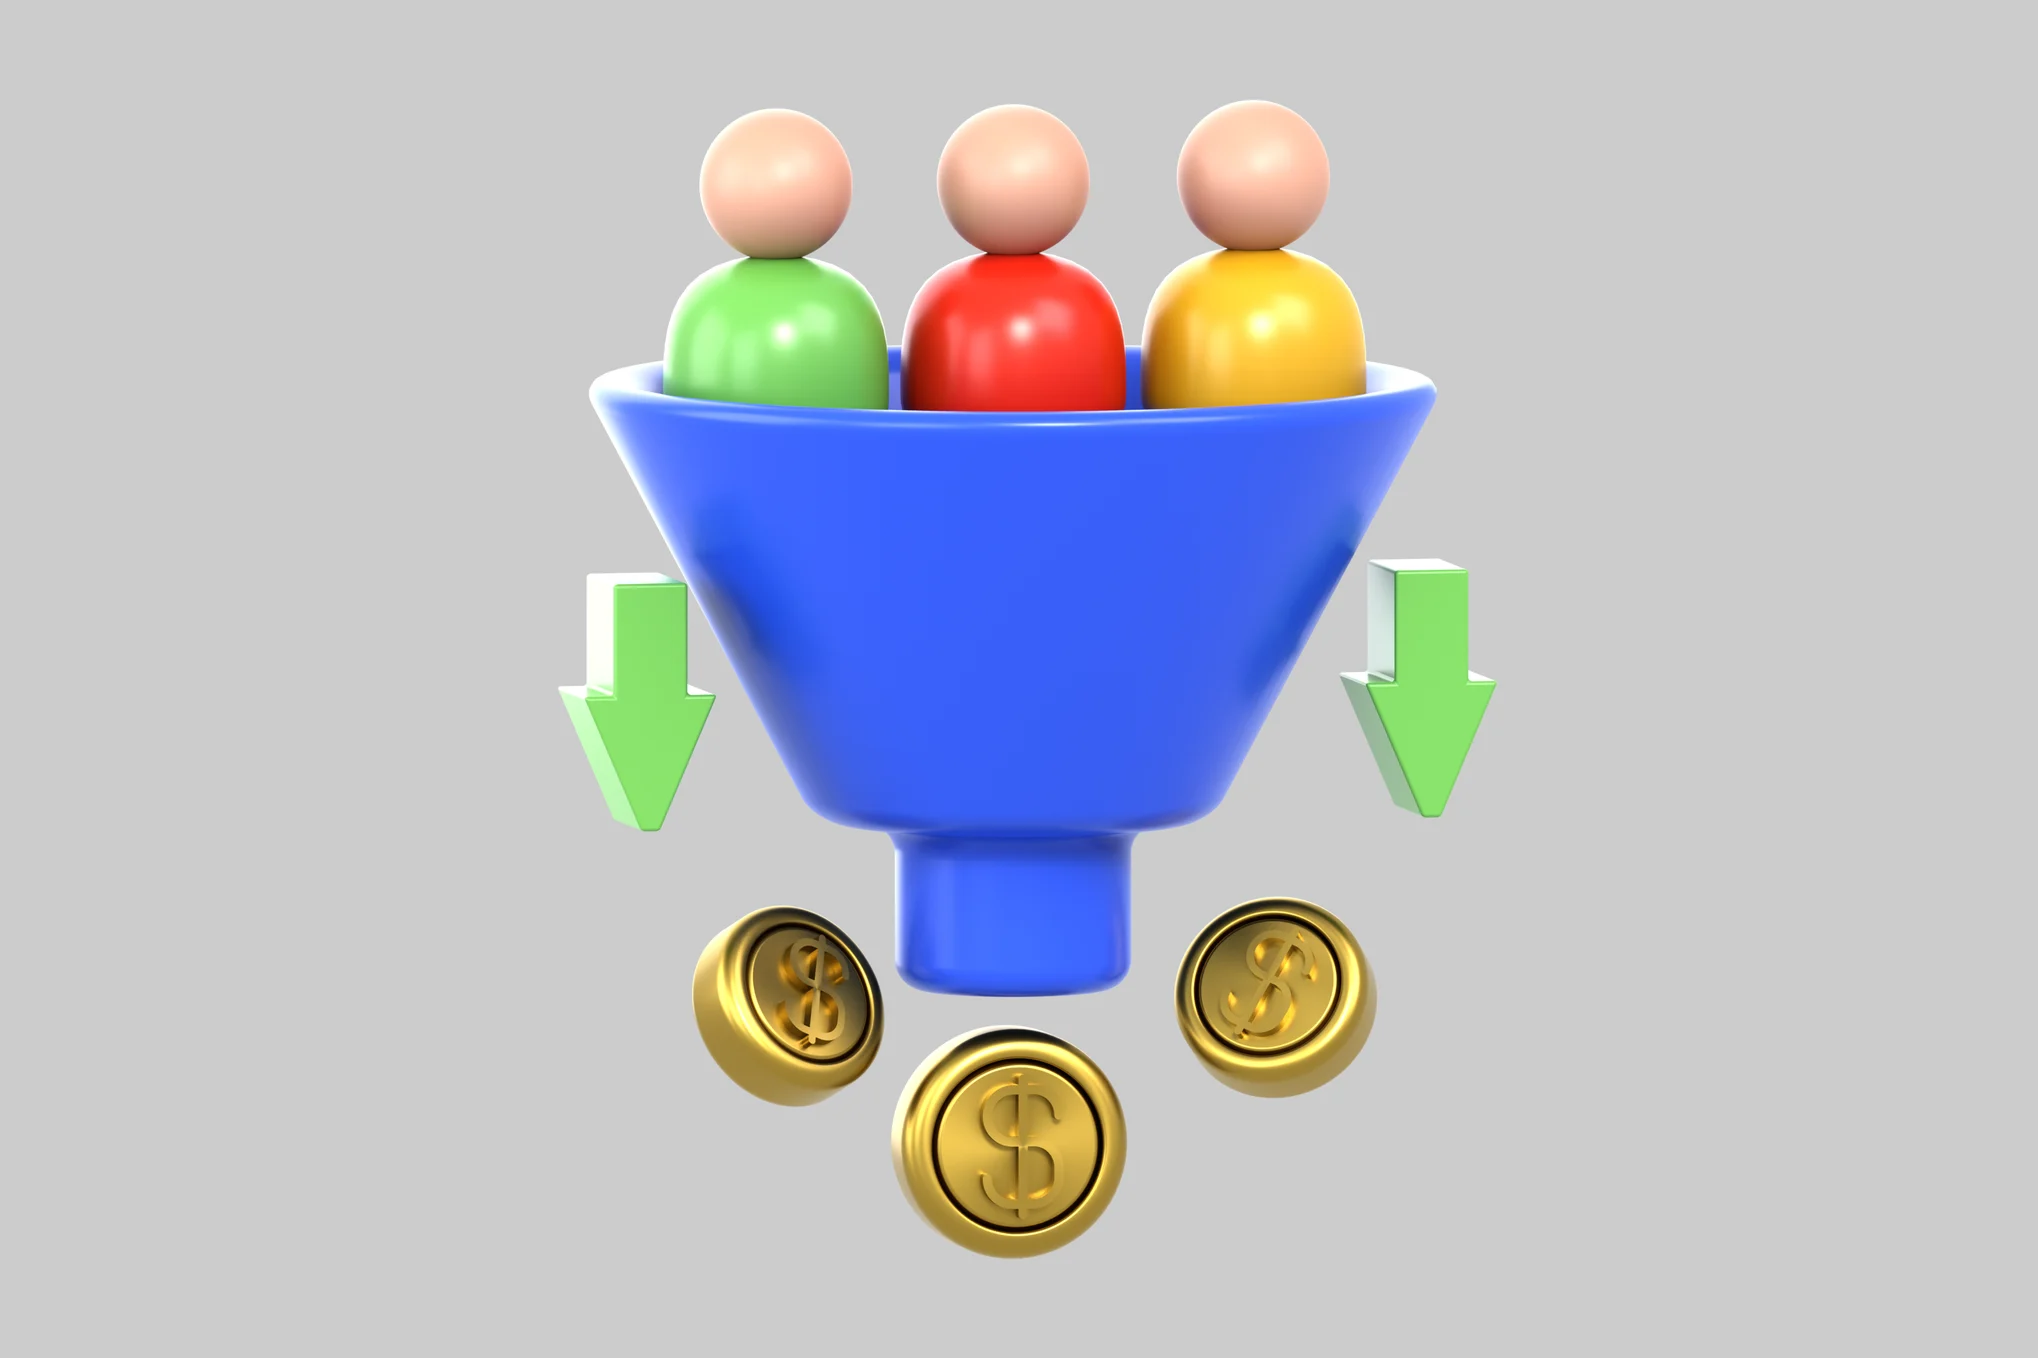
The visual below shows how this process filters a wide audience down to a dedicated group of customers.

As you can see, each stage naturally contains a smaller, more qualified group of people than the one before it.
To help you keep these stages straight, here’s a quick summary table.
Quick Overview of Conversion Funnel Stages
| Funnel Stage | User’s Goal | Key Business Question |
| Awareness | To find information and potential solutions for a problem. | How do new customers discover our brand for the first time? |
| Consideration | To evaluate different options and find the best fit. | What content or proof helps users choose us over others? |
| Conversion | To make a purchase, sign up, or complete the desired action. | What might stop someone from completing the final step? |
This table provides a simple framework for thinking about what your users need at each step and what your business should be asking itself.
Why Funnel Analysis Is a Game-Changer for Growth
Without analyzing your funnel, you’re essentially just guessing. You might be throwing cash at ads to attract more people (Awareness) when the real roadblock is a clunky, confusing checkout process (Conversion).
The true power of conversion funnel analysis is that it replaces gut feelings with hard data. It gives you a roadmap to find the exact points of friction in your customer journey so you can make smart, targeted improvements.
Think about it: turning a curious visitor into a loyal customer is tough. For ecommerce, the journey from a landing page to a product page and finally through checkout is full of potential drop-off points. In fact, industry benchmarks from sources like Shopify show that a typical ecommerce site only converts about 2% of its visitors into buyers. That leaves a massive 98% of visitors on the table—a huge opportunity for anyone willing to dig into the data.
By tracking your funnel, you can see how your efforts impact results over time. You stop hoping for growth and start engineering it.
How to Read Your Funnel: The Metrics That Matter Most
How to Read Your Funnel: The Metrics That Matter Most

Think of conversion funnel analysis as learning to read your customer’s mind. Your analytics dashboard isn’t just a collection of numbers; it’s a story, written in the language of user behavior. Each metric is a clue, telling you exactly where people are succeeding and where they’re getting stuck. To truly improve your funnel, you have to look past the raw data and start interpreting that story.
These data points are your diagnostic tools. A sudden drop in one metric or a steady decline in another are symptoms of bigger problems hiding under the surface. Let’s break down the most critical metrics so you can learn to read the signs and understand what they’re telling you about your funnel’s health.
The Big Picture vs. The Small Leaks
Every good analysis starts from two perspectives: the overall success rate and the specific places where things are going wrong. You need both to get the full picture.
- Overall Conversion Rate: This is your headline number. It’s the ultimate measure of your funnel’s effectiveness, telling you what percentage of all visitors who entered the funnel actually completed the final goal, like a purchase or a sign-up. It’s a simple but vital benchmark for tracking your performance over time.
- Stage-by-Stage Drop-off Rate: If your overall conversion rate is the final score, the drop-off rate shows you the play-by-play. This metric reveals the percentage of users who bail at each specific step. A high drop-off between someone adding an item to their cart and starting the checkout process points to a completely different problem than a high drop-off during the final payment step.
This is where your analysis gets really powerful. For instance, discovering that 70% of users abandon the funnel on the shipping information page is a huge red flag. It immediately tells you to investigate potential culprits: are shipping costs too high? Is the form confusing? Are there not enough delivery options? Pinpointing these leaks is the first, most important step to plugging them.
Understanding the Journey’s Pace and Value
It’s not enough to know who converts and who doesn’t. To build a truly effective strategy, you need to understand the how and how much behind each conversion. This is where you add crucial layers of insight to your analysis.
“Metrics like Time to Conversion and Customer Lifetime Value shift the focus from a single transaction to the long-term relationship. They help you understand not just if you made a sale, but if you acquired a valuable, loyal customer.”
A deep dive into your funnel means looking at financial and time-based metrics to gauge the real return on your marketing efforts.
| Metric | What It Measures | Why It’s So Important for Analysis |
| Time to Conversion | The average time it takes a user to go from their very first touchpoint to a final conversion. | A long conversion time could signal a complex buying process or user hesitation. Shortening this cycle can improve efficiency and the customer experience. |
| Customer Lifetime Value (CLV) | The total revenue you can realistically expect from a single customer over the entire course of their relationship with your business. | CLV gives your acquisition costs crucial context. A high Cost Per Acquisition (CPA) is perfectly fine if the customer’s CLV is significantly higher, ensuring your long-term profitability. |
For example, you might discover that customers coming from organic search take longer to convert but have a 30% higher CLV than those from paid social ads. An insight like that is gold. It helps you balance your budget and channel your efforts toward attracting more profitable, long-term customers instead of just chasing quick wins.
It’s also crucial to have realistic benchmarks. Industry data shows the average sales funnel conversion rate hovers around 2.35%. However, top-performing companies often hit 5.31% or more. Landing pages see a similar trend, with the top 25% of pages converting at 5.31% and the absolute best reaching over 11.45%. This proves how optimizing just one stage—like your landing pages—can dramatically lift your overall results. You can explore more of these marketing funnel benchmarks to see how your numbers stack up.
By weaving these different metrics together, you move from just counting sales to truly understanding your customer’s journey. This is how conversion funnel analysis becomes your strategic advantage.
How to Conduct a Powerful Funnel Analysis
Let’s get practical. Turning a pile of abstract metrics into a real plan of attack is what conversion funnel analysis is all about. This is the moment you stop asking what is happening and start digging into why. You’re not just looking for a single broken link; you’re conducting an investigation into human behavior to find the exact points of friction that make people walk away.
Think of yourself as a detective. First, you secure the scene by setting up your tracking. Then, you gather all the evidence—the data. Finally, you start connecting the dots to build a credible theory about what went wrong. This systematic approach turns a potentially overwhelming job into a manageable, and frankly, fascinating process.
Step 1: Lay the Groundwork with Proper Tracking
Before you can analyze anything, you need data you can trust. The very first step is making sure your analytics tools, like Google Analytics, are properly set up to track every single step in your customer’s journey. This means defining each stage as a specific goal or event.
For an e-commerce store, that journey might look something like this:
- Event 1: A user views a product page.
- Event 2: They add an item to their cart.
- Event 3: They click to initiate the checkout process.
- Event 4: They successfully complete the purchase.
If you don’t have clear event tracking for each of these key moments, you’re flying blind. You won’t see where people are dropping off, which makes the rest of this exercise pointless. Solid setup is the non-negotiable foundation for everything that follows.
Step 2: Segment Your Audience for Deeper Insights
Here’s a critical truth: not all visitors are the same. So why would you analyze them as one giant, anonymous blob? Segmentation is where the magic happens. It’s the simple act of slicing your audience into smaller, more specific groups based on shared characteristics. This is where you’ll find your biggest “aha!” moments.
Try slicing your data by:
- Traffic Source: Do visitors from organic search behave differently than people who clicked on a paid ad?
- Device Type: Are mobile users abandoning their carts more often than desktop users? (Spoiler: they probably are.)
- Demographics: Are brand-new visitors bailing at a higher rate than your loyal returning customers?
Analyzing these segments separately often exposes problems that are completely hidden when you only look at the overall average. You might discover that while your funnel looks okay on the surface, mobile users from a specific social media campaign are leaving in droves at one particular step. That’s the kind of granular detail you need to form a truly accurate hypothesis.
By looking at your funnel through different lenses, you can isolate problems that affect specific user groups. This prevents you from making broad changes that might not address the root cause of a leak.
A deep analysis also requires looking at performance over time. You need to see how users move through your funnel historically—day by day, week by week. As detailed in advanced guides, this view helps you spot trends and react to shifts in user behavior. You can learn more by exploring how to visualize funnel performance over different time intervals on mparticle.com.
Step 3: Pinpoint the Bottlenecks and Form a Hypothesis
Okay, you’ve got tracked data and you’ve segmented your audience. Now it’s time to hunt for the biggest leaks. Scan your data for the largest percentage drop-off between any two stages. That’s your primary bottleneck, and it’s screaming for your attention.
Let’s imagine a typical checkout process:
- Cart Page: 1,000 users
- Shipping Page: 500 users (50% drop-off)
- Payment Page: 450 users (10% drop-off)
- Confirmation: 400 users (11% drop-off)
That massive 50% nosedive between the cart and shipping pages is a huge red flag. Now, you can form a testable hypothesis: “Users are abandoning the funnel on the shipping page because they are being surprised by high shipping costs.”
See how that works? It’s a strong, specific hypothesis that you can actually test. You could design an A/B test (like showing shipping costs earlier) to see if your change plugs the leak. This methodical approach beats random guesswork every time. If your site is particularly complex, technical issues could be a factor. Consider a professional SEO audit to uncover technical barriers that might be contributing to these frustrating drop-offs.
Essential Tools for Conversion Funnel Analysis
To get this job done right, you need the right tools in your belt. While there are countless options out there, a few stand out for their ability to provide the specific data needed for funnel analysis. The table below breaks down some of the most popular and effective tools, showing you what they’re best for and their key features.
| Tool Name | Primary Use Case | Key Features for Funnel Analysis |
| Google Analytics 4 | Web and app analytics | Funnel exploration reports, segment comparisons, event-based tracking, real-time data. |
| Hotjar | User behavior visualization | Heatmaps, session recordings, on-page surveys, and feedback widgets to understand the “why” behind the numbers. |
| Mixpanel | Product and user engagement analytics | Advanced funnel analysis, retention tracking, user cohort analysis, and detailed user journey mapping. |
| FullStory | Digital experience intelligence and session replay | Pixel-perfect session replay, frustration signal detection (e.g., rage clicks), and conversion funnels. |
Choosing the right combination of these tools gives you a powerful one-two punch: quantitative data to tell you what is happening, and qualitative insights to tell you why. This complete picture is what separates a good analyst from a great one.
Finding and Fixing Common Funnel Leaks

Let’s be honest: every conversion funnel leaks. No matter how perfectly you plan it, you’re going to lose some potential customers along the way. The real difference between a funnel that prints money and one that just drains your budget isn’t the absence of leaks—it’s how quickly you find and fix them. This is where conversion funnel analysis becomes your secret weapon, acting like a diagnostic scan to pinpoint exactly where people are dropping off.
Think of your funnel as a plumbing system. A tiny, slow drip might not seem like a big deal at first, but over weeks and months, it can lead to serious water damage. In the same way, small friction points in your customer’s journey can add up to a huge loss in sales. This is your practical guide to troubleshooting the most common conversion killers and applying fixes that actually work.
Leaks at the Top of the Funnel
This is where you make your first impression. Or, all too often, where you lose someone before they even get a chance to see what you offer. Leaks at the top—the awareness and consideration stages—usually boil down to a broken promise or a bad first experience.
A classic mistake is a mismatch between your ad and your landing page. Imagine someone clicks an ad for a “50% off everything” sale, only to land on your standard homepage with no mention of the discount. Their immediate reaction? “This isn’t what I was promised.” That disconnect instantly shatters trust and sends your bounce rate through the roof.
Another huge leak is slow page speed. We’ve all been there. You click a link, and the page just hangs. And hangs. If your site takes more than three seconds to load, you’re losing a huge chunk of visitors who simply don’t have the patience to wait. This is especially true on mobile, where patience is even shorter.
To patch these top-of-funnel leaks, here’s where to start:
- Align Your Messaging: Make sure your ad copy, headlines, and visuals are perfectly consistent with what users see on the landing page. The offer should be front and center. Reassure them they’ve landed in the right spot.
- Optimize for Speed: This is a technical fix with a massive payoff. Compress your images, use browser caching, and clean up your code to get those load times under three seconds.
Leaks in the Middle and Bottom of the Funnel
Okay, so you got them onto your site and they’re showing interest. Great! But now a whole new set of potential problems appears. These leaks are usually caused by friction during the final decision-making and purchase process. The most infamous leak of all? Cart abandonment. Someone likes your product enough to add it to their cart but bails before paying.
A major driver of cart abandonment is sticker shock from unexpected costs. When a customer gets all the way to the final checkout step and suddenly sees a high shipping fee or surprise tax, it feels like a bait-and-switch.
Take a hard look at your checkout experience. Is it a long, complicated slog? Are you asking for their life story just to buy a t-shirt? A checkout form with a dozen fields can feel overwhelming and is a surefire way to frustrate someone into leaving.
Here are some of the most effective ways to plug these critical leaks:
- Be Transparent with Pricing: Show all costs, especially shipping and taxes, as early as you can. Displaying them on the product page or in the cart itself prevents nasty surprises at the end.
- Simplify Your Checkout: Offer a guest checkout option—don’t force account creation. Keep your forms short and sweet, and use features like auto-fill for addresses to make it painless.
- Use Exit-Intent Offers: These pop-ups trigger when it looks like a user is about to leave the page. A last-second offer for a small discount or free shipping can be the little nudge they need to finish the purchase.
- Build Trust: Plaster your site with trust signals. Security badges (like from McAfee or Norton), clear return policies, and glowing customer reviews all help reduce anxiety and make people feel safe buying from you.
Fixing these common leaks isn’t magic; it’s a methodical process of combining data with a real understanding of how people think and act. For many businesses, juggling the technical and strategic sides of this can be a lot to handle. Bringing in experts can fast-track your results, and you can learn more about how to find a reliable team by outsourcing SEO services to manage these crucial optimizations. By tackling these issues one by one, you can transform your leaky funnel into a powerful conversion machine.
Of course. Here is the rewritten section with a more natural, human-expert tone.
Funnel Optimization in the Real World: Two Case Studies
Theory is one thing, but seeing how funnel optimization actually works on the ground is where the real learning happens. It’s easy to talk about stages and metrics in the abstract. It’s another to watch a business pinpoint a single problem and see a measurable jump in their success.
Let’s look at a couple of real-world examples. These aren’t just success stories; they’re roadmaps. Each one breaks down a common business headache into a clear problem, the analysis that uncovered the “why,” the fix they implemented, and the impressive results.
Case Study 1: The SaaS Company’s Onboarding Mystery
Imagine a growing SaaS company that sells project management software. They had a great marketing engine—plenty of people were signing up for their 14-day free trial. But then, things went quiet. Their trial-to-paid conversion rate was tanking, and they couldn’t figure out why. The top of the funnel was wide open, but there was a serious leak somewhere in the middle.
The Analysis
Instead of just throwing ideas at the wall, the team got methodical. They used their product analytics software to see exactly what trial users were doing (and not doing) inside the app. What they found was a genuine surprise: over 60% of trial users never even clicked on the automated reporting dashboard, one of the platform’s most valuable features.
To get the full picture, they watched session recordings. They saw user after user set up a project, click around for a bit, and then stall out. They were completely missing the one feature that would have given them that “aha!” moment—the one that separated this tool from a simple to-do list.
The problem wasn’t a bug, and it wasn’t the price. It was an education gap. Users weren’t experiencing the product’s true value before their trial ended.
The Solution and Result
With such a clear diagnosis, the fix was obvious. They needed to completely rethink their user onboarding.
- First, they built a new interactive tutorial that didn’t just show users the ropes but actively guided them to create their very first report.
- Next, they added simple in-app tooltips to draw attention to the reporting feature and spell out its benefits.
- Finally, they set up an automated email that went out on day three of the trial, specifically highlighting what the dashboard could do for them.
It worked. By focusing on closing this one educational gap, the company boosted its trial-to-paid conversion rate by a massive 22% in just three months.
Case Study 2: The E-commerce Checkout Disaster
Now let’s switch to an online store selling unique home goods. They had a problem that keeps many e-commerce owners up at night: a staggering cart abandonment rate of nearly 80%. Customers clearly loved the products—they were adding them to their carts in droves. But something was scaring them away right at the finish line, costing the business a fortune in lost sales every day.
The Analysis
The team suspected the issue was at the very end of the checkout, probably on the payment page. To be sure, they used Google Analytics to track every single step of the checkout process. The data told a different story. The biggest drop-off wasn’t at the payment step; more than half the people were leaving on the shipping details page.
This was a huge clue. Using a tool like Hotjar, they watched recordings of people who bailed at that exact moment. The pattern was undeniable: a user would enter their address, the shipping cost would pop up, and they’d close the tab instantly. The unexpected shipping fee was a deal-breaker.
The Solution and Result
The culprit was sticker shock. Armed with this knowledge, they rolled out a two-part solution:
- Upfront Shipping Calculator: They added a simple shipping cost estimator right on the product and cart pages. No more surprises.
- Free Shipping Threshold: They started offering free shipping on all orders over $75, giving shoppers a clear incentive to spend a little more.
These simple changes created the price transparency their customers needed. The impact was immediate. The retailer cut its cart abandonment rate by 35%. As a bonus, the average order value (AOV) shot up by 15% because people were happy to add another item to their cart to qualify for free shipping.
Building a Culture of Continuous Optimization
Think of your conversion funnel not as a project with a start and finish line, but as a living part of your business. The truly successful companies don’t just “do” funnel analysis once a quarter. They bake it into their daily operations, creating a continuous loop of improvement. This mindset is what really separates fleeting wins from genuine, long-term growth.
This is about shifting from sporadic check-ins to a steady, consistent rhythm of evaluation. It’s about cultivating a culture where data-driven curiosity isn’t a task—it’s the default setting. Instead of scrambling when sales suddenly dip, your team is already hunting for the next optimization opportunity, week in and week out.
The Iterative Optimization Cycle
The secret to making this a habit is adopting a simple, repeatable framework. This cycle turns raw data into real action, making sure your funnel is always adapting to your customers. It’s a loop that doesn’t really have an end.
The process breaks down into four clear steps:
- Analyze: Dive into your analytics. Use your tools to find a bottleneck, a point of friction where people are dropping off.
- Hypothesize: Based on what you found, form a clear, testable idea. For instance, “I believe changing our checkout button from blue to orange will get more clicks because the contrast is much stronger.”
- Test: This is where the rubber meets the road. Run a controlled A/B test to see if your hypothesis is correct. Testing stops you from making changes based on a hunch and proves what actually works.
- Measure: Once your test has run its course, dig into the results. Did the new version improve the metric you were targeting? If it’s a winner, roll it out. If not, that’s okay—you’ve learned something valuable. Time to form a new hypothesis.
This Analyze, Hypothesize, Test, Measure cycle should become the heartbeat of your marketing and product teams. It ensures every single change you make is deliberate and backed by solid evidence.
Looking Beyond the Numbers
While your analytics dashboards are great at telling you what is happening, they often fall short of explaining why. To build a truly effective optimization culture, you have to pair that hard data with qualitative insights. This is where you find the human stories hidden within the metrics.
A culture of continuous optimization thrives on empathy. It combines the ‘what’ from analytics with the ‘why’ from real user feedback to create a complete picture of the customer experience.
Make these methods a regular part of your analysis:
- User Surveys: Just ask! A simple post-purchase survey or a pop-up on an exit-intent can uncover pain points you would never have guessed on your own.
- Session Recordings: Watch how real people actually use your website. Seeing someone hesitate, rage-click a broken link, or get stuck in a loop provides context that numbers on a chart simply can’t.
When you weave together this constant process of testing with genuine user feedback, you’re doing more than just patching leaks in your funnel. You’re building a dynamic growth engine that gets smarter over time. This proactive approach is also fundamental when you create a winning SEO strategy designed to deliver results that last.
Building a Culture of Continuous Optimization

Even after laying out a perfect strategy, you’re bound to run into some practical questions. Let’s tackle a few of the most common ones that come up when you start digging into conversion funnel analysis.
How Often Should I Analyze My Funnel?
The best answer here depends on how deep you plan to go. For a quick pulse check, you should be looking at high-level funnel metrics—things like overall conversion rates and major drop-offs—at least weekly. This helps you spot any sudden problems before they snowball.
For the more intensive work, like segmenting audiences, watching session recordings, and developing new theories to test, a quarterly deep-dive is usually best. This gives your changes enough time to gather meaningful data and keeps you from overreacting to small, random dips in performance.
Does Funnel Analysis Apply to Non-E-commerce Sites?
Absolutely. The core concepts of conversion funnel analysis work for any business with a website and a goal. A “conversion” is simply the valuable action you want a visitor to take.
For businesses that don’t sell products online, a conversion could be:
- A potential client filling out a lead-gen form.
- A new user signing up for a SaaS free trial.
- A visitor downloading a resource like a whitepaper or e-book.
If your website has a purpose, it has a funnel. Pinpointing where users get stuck is just as crucial for a B2B service company as it is for a massive online store.
The goal is always to understand the path a user takes to complete a meaningful action. It doesn’t matter if that action is a purchase or a newsletter sign-up; the process of finding and eliminating friction is exactly the same.
What Is a Good Conversion Rate?
This is the classic million-dollar question, and the honest answer is: it’s all relative. There’s no magic number. A “good” conversion rate is completely dependent on your industry, your business model, where your traffic comes from, and even the price of your product.
Think about it: a business selling high-end enterprise software for thousands of dollars will naturally have a much lower conversion rate than an app offering a simple, free download.
Instead of getting hung up on an industry benchmark, focus on improving your own numbers. The real win is seeing your conversion rate climb month over month. That’s the true measure of a successful optimization strategy.
Ready to stop guessing and start fixing the leaks in your funnel? The expert team at PieNetSEO uses data-driven conversion funnel analysis to identify opportunities and drive measurable growth for your business. Let’s build a more profitable customer journey together. Learn more by visiting us at https://www.pienetseo.in.